


€ 48,99 Gratis verzending

Uitgelicht
|
|
48,99 |
Naar shop
|
| VERGELIJK ALLE AANBIEDERS (1) | ||
 Beschrijving
Vergelijk aanbieders (1)
€ 48,99 Gratis verzending
Winkels met andere maten
Beschrijving
(1)
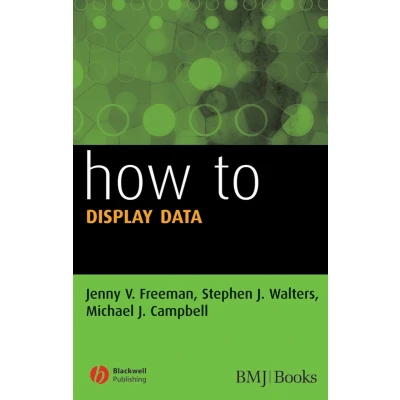
A new addition to the popular 'How To' series Shows how to present data in journal articles, grant applications or research presentations correctly and comprehensively Contains numerous examples of good and bad data display Contains examples from many areas of research - including those outside of medicine. Effective data presentation is an essential skill for anybody wishing to display or publish research results, but when done badly, it can convey a misleading or confusing message. This new addition to the popular “How to” series explains how to present data in journal articles, grant applications or research presentations clearly, accurately and logically, increasing the chances of successful publication. Packed with real examples from scientific literature, this instructive handbook describes appropriate methods for displaying a variety of quantitative information using both graphs and tables, to enhance the interpretation of scientific research. Examples of bad presentation highlight the pitfalls of data display and will ensure that readers never fall into the same traps! Written in a readable and accessible style, How to Display Data is a must-have guide for anyone who needs to present data in journal articles, grant applications, or at research meetings. Clear and accurate presentation of data is an essential part of medical publication. Currently the standard in journals and at conferences is poor. This short and easy-to-use book shows you how to present data clearly and logically, helping you to get your submission accepted. It has plenty of examples of good and poor data display, and the final chapter reviews existing software. Effective data presentation is an essential skill for anybody wishing to display or publish research results, but when done badly, it can convey a misleading or confusing message. This new addition to the popular “How to” series explains how to present data in journal articles, grant applications or research presentations clearly, accurately and logically, increasing the chances of successful publication.
 Productspecificaties
| EAN |
|
|---|---|
| Maat |
|
 Prijshistorie
Prijzen voor het laatst bijgewerkt op:
 Gerelateerde resultaten


